Multifamily Acquisition Template
Single-asset multifamily acquisition with optional value-add and optional mixed-use commercial.
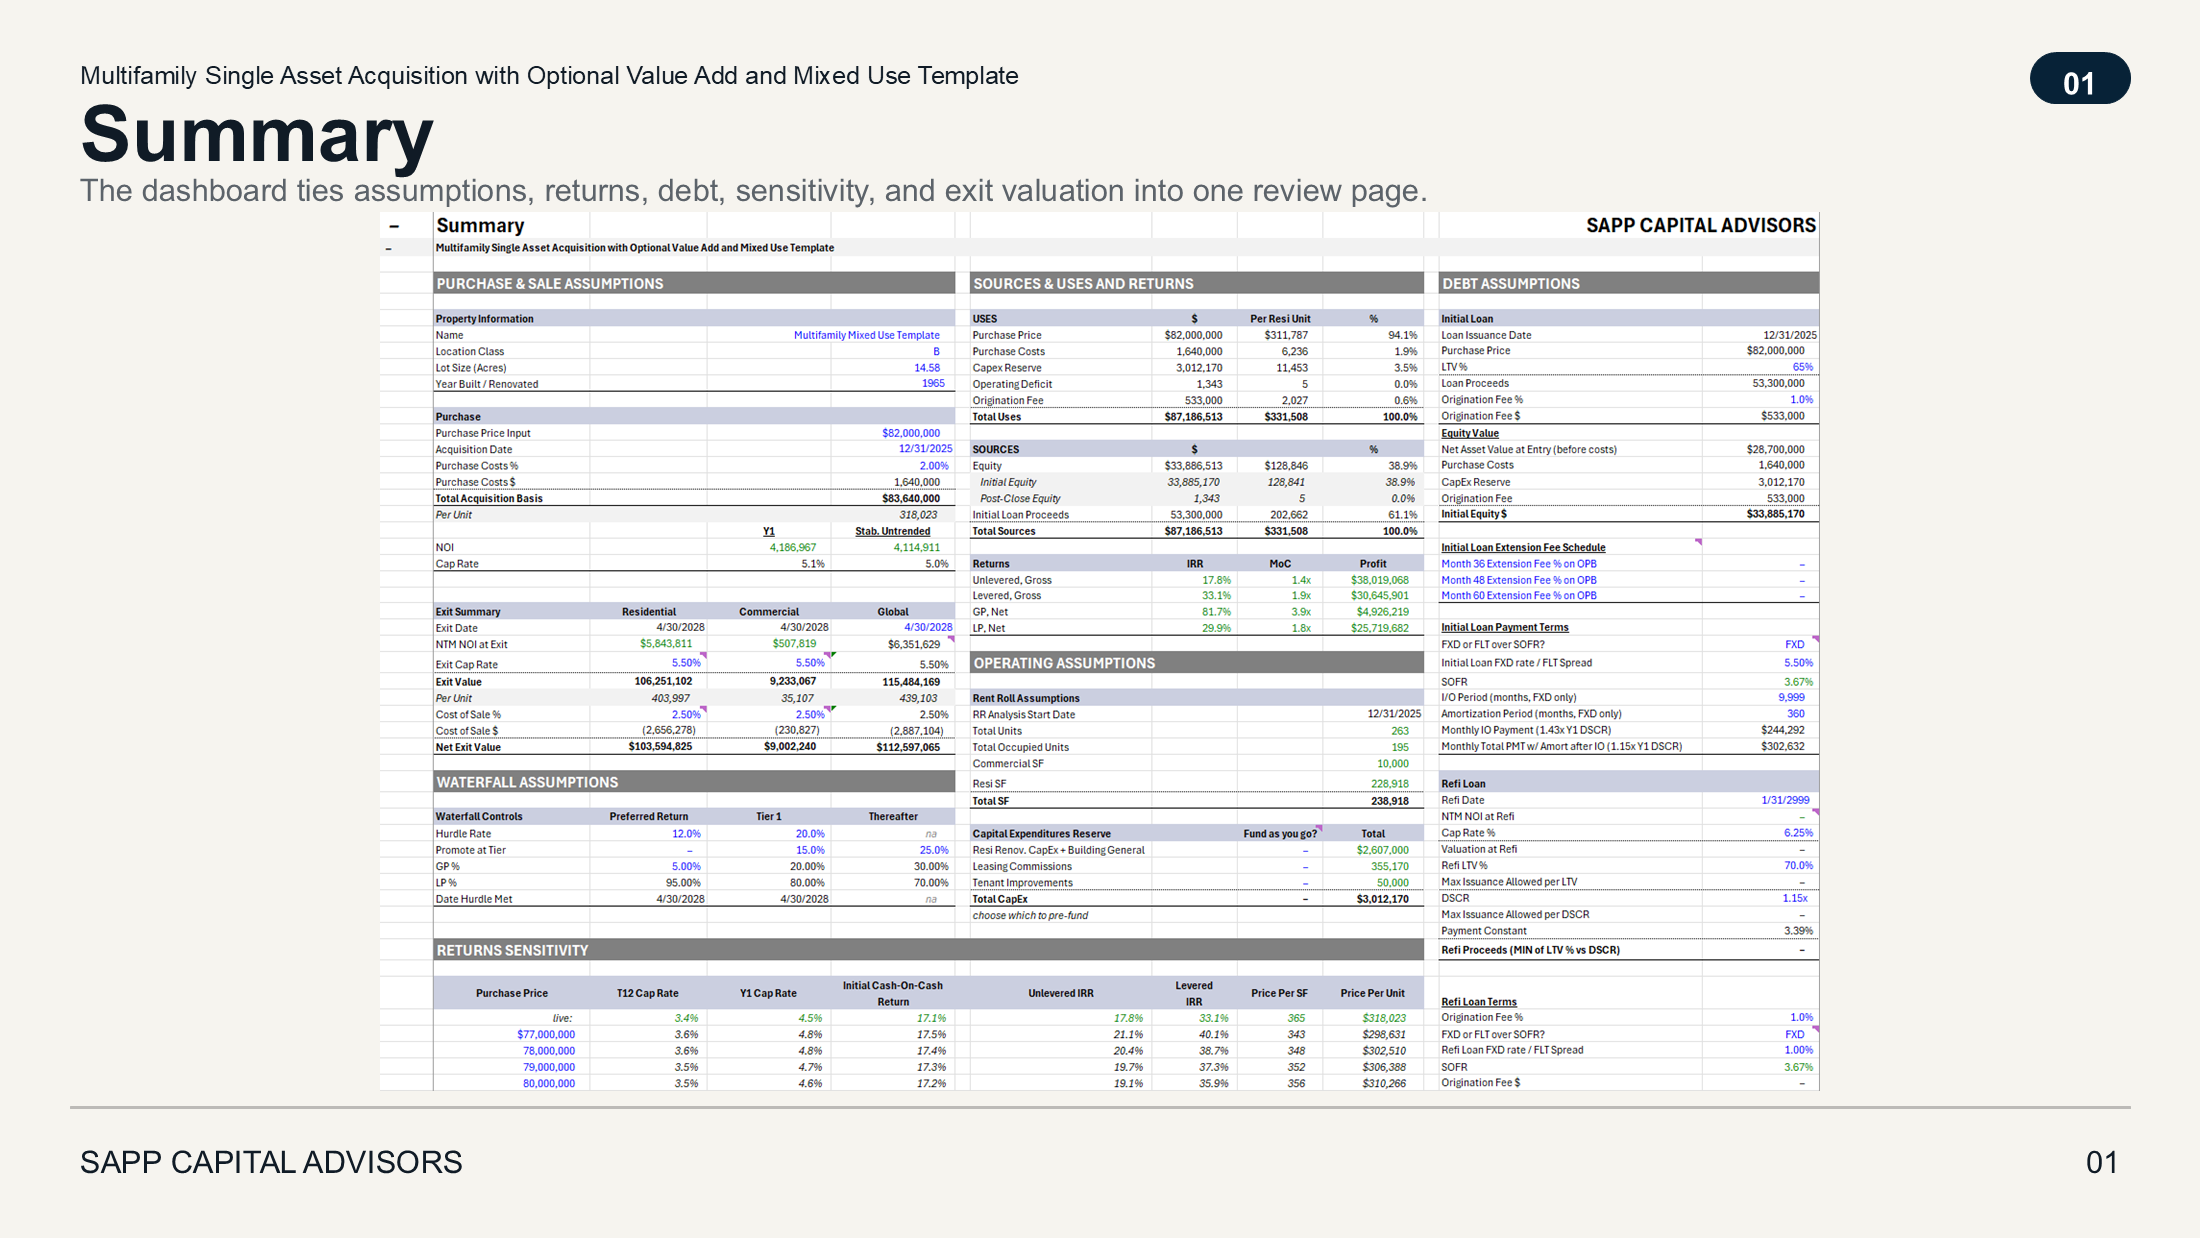
A monthly cash-flow model for multifamily acquisitions, from rent roll to returns. Optional modules for (1) value-add renovations and (2) commercial NOI; either can be toggled off or removed from the model entirely.
Why This Template
The residential and commercial pieces are modular, for more granular valuation on mixed-use deals: the commercial component carries its own NOI and its own exit cap, insurance and utilities run on their own growth curves, and renovation vacancy sits on its own line. The Summary's sensitivity table runs returns across a range of purchase prices (or any other variable you're looking to sensitize). Things get more layered when the value-add program runs alongside a refi where the lender wants the renovated rents stabilized for a defined seasoning period before sizing on the new NOI.
What This Model Does
Start with a rent roll. Define your business plan. The model flows everything through:
- Income (separate Residential and Commercial)
- Expenses (per-line OpEx detail with per-line growth rates)
- Capital events
- Debt (acquisition debt, fixed or floating rate via the SOFR sheet, interest-only or amortizing, institutional refinance sizing)
- Investor returns (waterfall with preferred return, tiered promote, configurable GP / LP splits, IRR, MoC, profit)
Core Capabilities
Underwrite from Rent Roll to NOI
Unit-level assumptions flow into forward income and stabilized performance. Physical vacancy is split into General Vacancy and Renovation Vacancy as distinct lines rather than blended together. RUBS is carried on its own income line.
- Pre- and post-renovation rents
- General Vacancy, Renovation Vacancy, Credit Loss, Concessions modeled separately
- Ancillary income and RUBS as distinct lines
Value-Add with Timing Built In
Renovation strategy modeled with operational impact, not floated as a separate line item.
- Renovation timing by unit type
- Rent premiums and cost per unit
- Renovation Vacancy as a distinct line from General Vacancy, so the program's cost shows up in vacancy terms
- Building general CapEx as its own input, separate from unit-level renovation
Mixed-Use Commercial Module
The model values the residential and commercial components separately, each on its own cap rate. The commercial side sits on its own subsheet with its own NOI and exit cap, and the Exit Summary breaks out Residential, Commercial, and Global columns. Toggle the commercial module off for a pure-residential deal, or use the residential-only version of the template for a simpler workbook without the commercial tabs.
- Lease-by-lease modeling for the commercial component
- TI / LC and lease timing
- CAM and commercial operating assumptions
- Separate NOI and separate valuation per the institutional convention
Per-Line OpEx with Per-Line Growth
Insurance is rising 8% a year. Utilities aren't. Real estate taxes vary by jurisdiction reset cycles. Modeling all of them on a single blended growth rate distorts the deal. The template carries Real Estate Taxes, Insurance, Utilities (Electric / Water / Gas), Service Contracts, Repairs & Maintenance, Payroll, G&A, Advertising, Legal, Turnover, Operating Reserves, and Management Fee on separate lines with separate growth rates.
Integrated Monthly Cash Flow
Every assumption hits a single monthly model.
- Full Sources and Uses
- Purchase price, closing costs, CapEx reserves rolled into total basis
- Debt and equity funding tied to that basis (Initial Equity + Post-Close Equity modeled as separate sources)
- Operating cash flow
- Capital expenditures with a "choose which to pre-fund" toggle across Resi Renovation + Building General + Leasing Commissions + Tenant Improvements
- Exit and proceeds
Debt, Refinance, and Exit
Capital structure options modeled in line.
- LTV-driven acquisition debt
- Fixed or floating rate (full SOFR sheet for floating-rate deals)
- Refinance sizing on the more conservative of LTV or DSCR
- Exit on forward NOI and cap rate
Investor Returns and Waterfall
Deal performance translated into investor outcomes.
- Unlevered and levered returns
- GP / LP waterfall with Preferred Return + Tier 1 + Thereafter structure
- Toggleable catch-up between Pref and Tier 1
- Date Hurdle Met surfaced on the Summary so the GP can see when promote kicks in
- IRR, MoC, profit
- Built-in Returns Sensitivity table across 12 purchase prices showing T12 cap, Y1 cap, initial cash-on-cash, and unlevered IRR
Built for Audit
Pure Excel. No macros, no VBA, no dynamic-array surprises. Every formula traces back to its source via Excel's precedents and dependents. The IC analyst on the buy-side can audit the model without calling us.
- Global Checks sheet aggregates per-sheet local checks. The model title row shows whether anything is broken.
- Built-in Change Log captures the WHY behind each assumption change, not just the what.
- Color conventions consistent across the library (blue inputs, green cross-sheet links, black formulas).
- Print areas defined on every sheet.
- The model enforces our underwriting principle on every refresh: all negative levered cash flows reconcile to equity contributions. If the model can't tie them out, the check fires before the IC tables get built.
Print-Ready Dashboard
The Summary sheet is built as an IC-style dashboard. Assumptions, returns, deal outputs, and the sensitivity table all in a presentation-ready layout. Every other sheet prints clean too.
What It's Designed For
- Multifamily single-asset acquisitions
- Value-add strategies with renovation
- Mixed-use deals with commercial space
- Analysts, investors, and teams underwriting deals in Excel
- Pure-residential multifamily acquisition without the commercial module (separate template available)
What It's Not
- Not a back-of-envelope screening model
- Not a development-first model (acquisition plus value-add is the lane)
- Not dependent on macros or complex systems
For cross-template conventions (color coding, check system, change log), see Modeling Standards →.
Explore Further
Use this on your next deal